
The Inequality Barometer is a representative online survey first conducted in Germany in 2020. It examines individual perceptions of different aspects of inequality and social mobility as well as a range of policy preferences related to inequality. The survey consists of a core module of questions that will be repeated in future waves, as well as several additional modules with a changing focus across waves.
The second survey wave
The second round of the Inequality Barometer was conducted between November and December 2022. A total of around 6,300 respondents took part, representing the adult resident population in Germany. On average, interviews lasted for 20 minutes. The results have been published and have been met with great interest.
Marius R. Busemeyer, Nanna Lauritz Schönhage, Sharon Baute, Luna Bellani, Guido Schwerdt (2023): Gloomy prospects: The Konstanz Inequality Barometer shows that inequality is perceived to have increased. Policy Paper 12: Inequality Barometer – Inequality and Social Mobility. 11 May 2023.
Abstract: Data from the new wave of the Konstanz Inequality Barometer shows that people in Germany perceive a widespread increase of inequality in income and wealth and barely distinguish between income and wealth inequality. This is despite the fact that wealth inequality is significantly larger than income inequality. At the same time, the actual level of inequality is still underestimated in some respects. Concerning the prospects of the younger generation, many people, especially supporters of the right-wing populist AfD, are rather negative. Less pessimism is found among supporters of the center-right parties, CDU/CSU and FDP.
-> Download the Policy Paper
Findings from the second survey wave
Read about some of the main findings from the latest wave of our survey below:
Distorted perceptions of income and wealth inequality
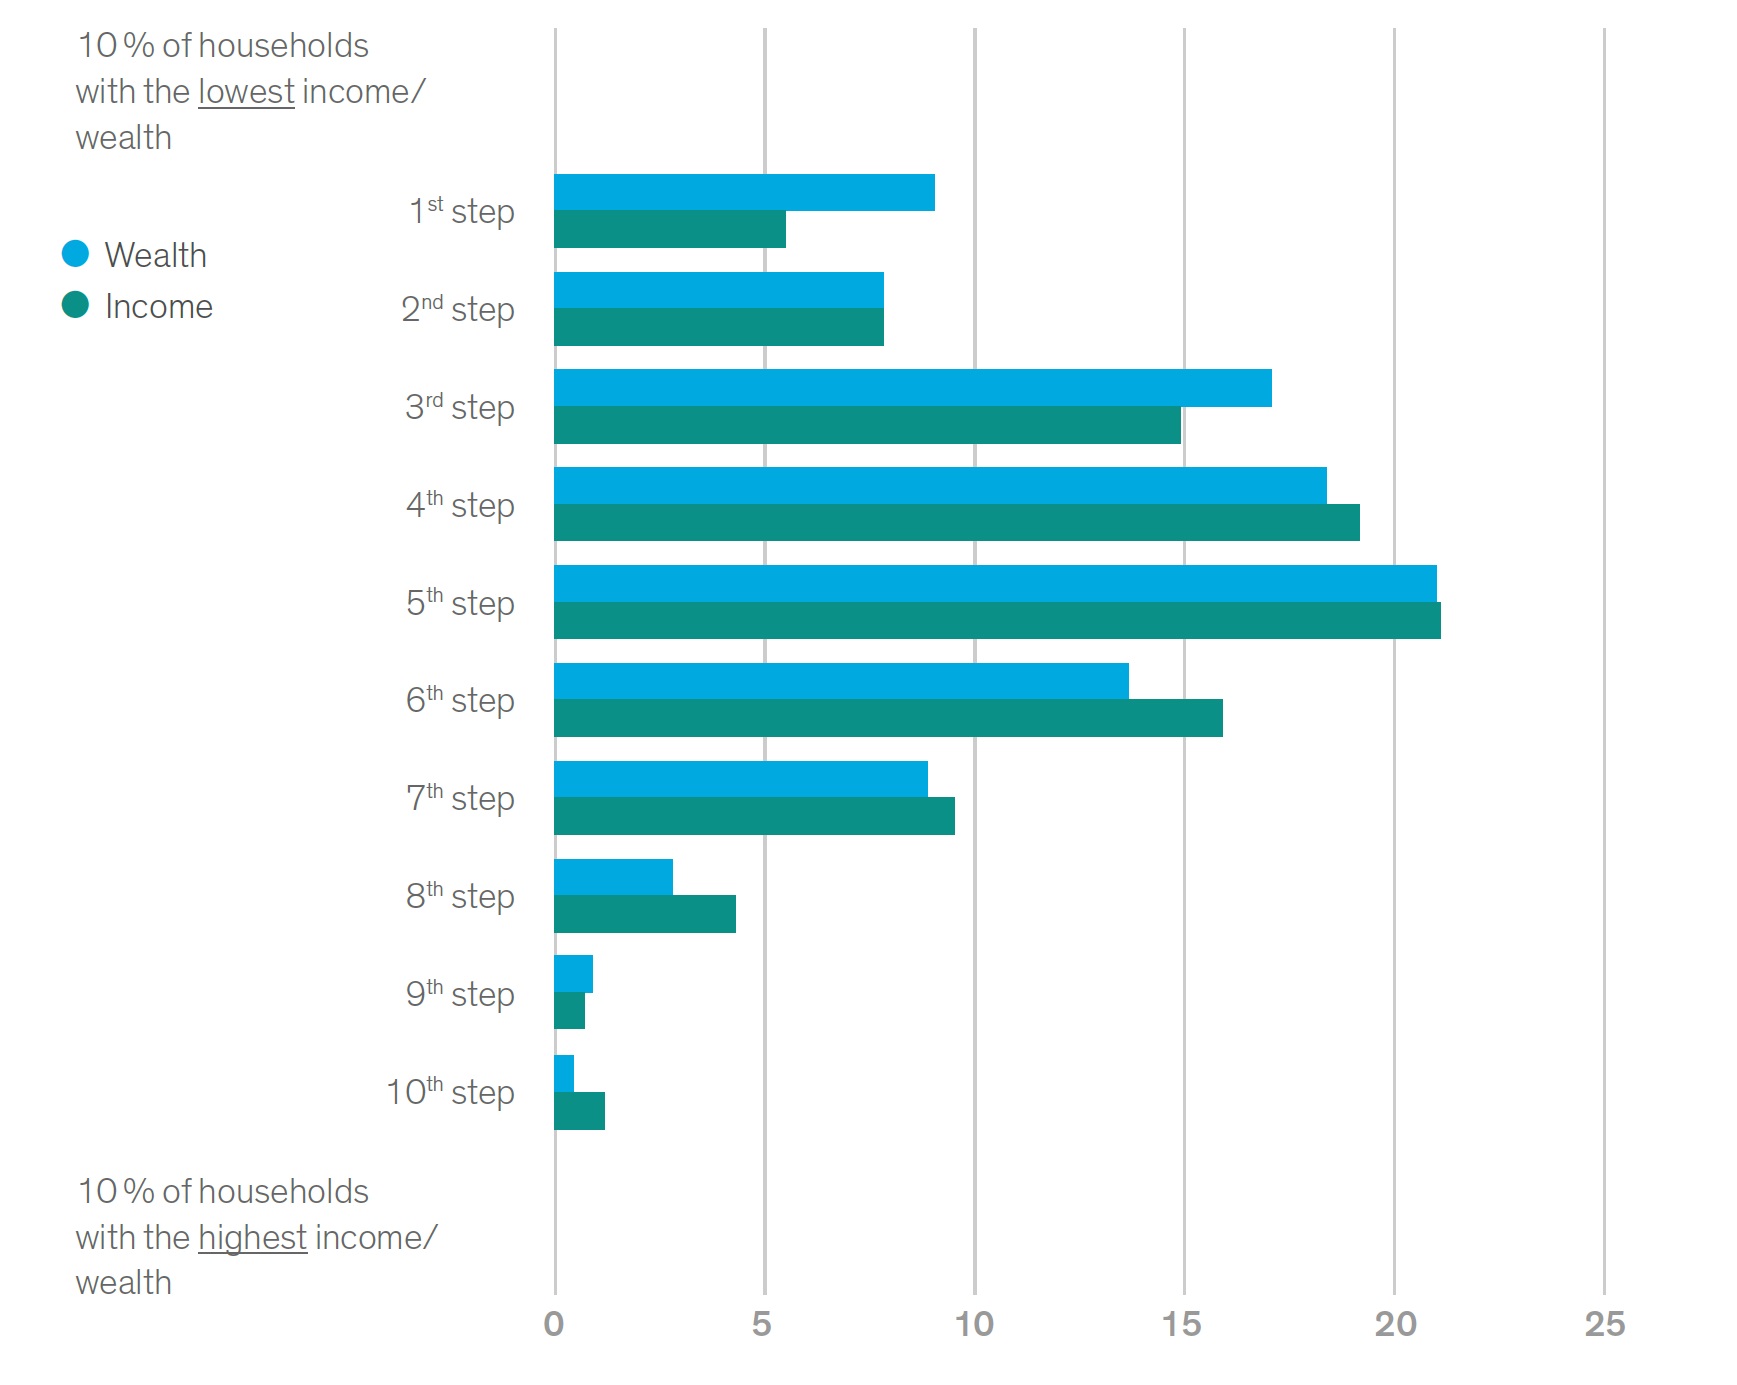
Respondents were asked to rate their relative position on a 10-step income or wealth ladder. The results show that self-assessments are quite similar across the different steps of the income and wealth ladders. This suggests that respondents generally do not distinguish between the distribution of wealth and income when asked to assess their own relative position.
This bias is much more pronounced for wealth distribution, which is much more unequal in favour of the upper classes compared to income distribution. However, respondents are, on average, unaware of this inequality. This lack of awareness makes it less likely that people will mobilise to support stronger redistributive policies - especially given the current debates on inheritance and wealth taxes. These debates suggest that many people middle-class people believe that they are directly affected by such taxes, despite that not being the case. They underestimate their relative wealth and overestimate their own relative poverty.
Perceptions of how long-term trends of inequality have evolved
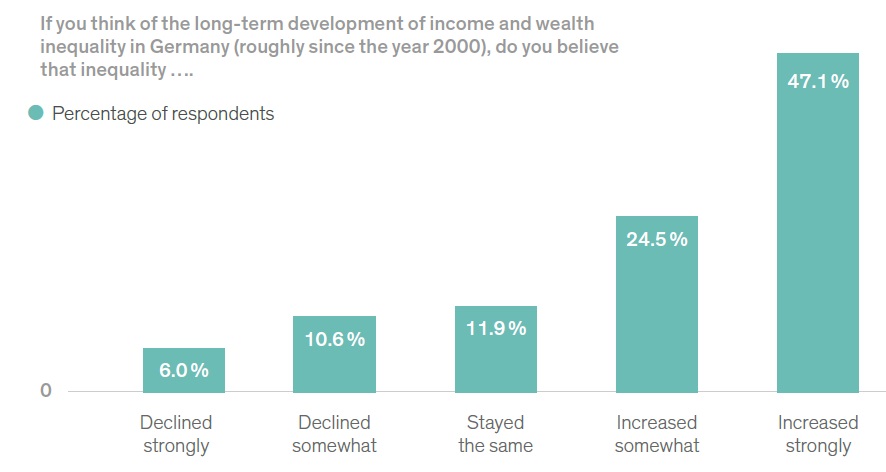
A rather pessimistic view emerges when respondents were asked about their perceptions of long-term trends in income and wealth inequality.
As shown below, a negative trend clearly dominates perceptions of long-term trends of inequality. Respondents were asked, from their point of view, whether inequality had increased or decreased over the past two decades. 45 percent believed that inequality has increased “strongly”, and a further 23 percent believe that it has increased “somewhat.” Here, too, there is a high degree of sensitivity to the issue of inequality.
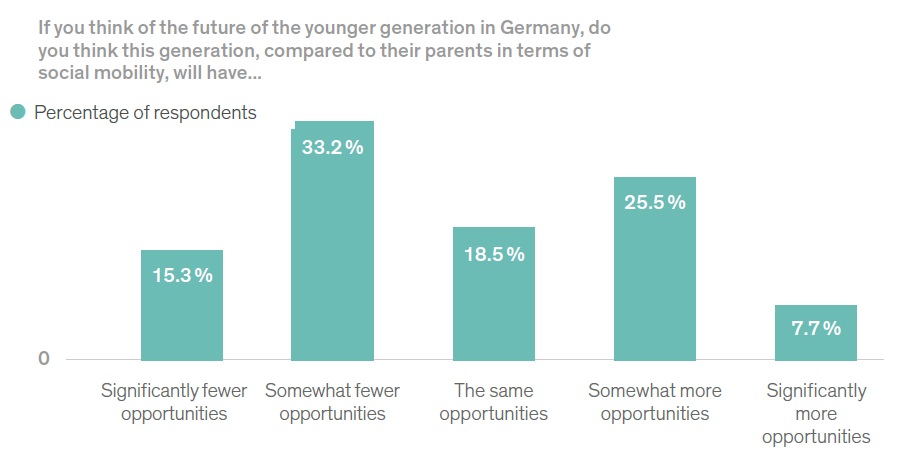
Assessing the prospects of future generations
Pessimism was also prevalent in how respondents assessed the prospects of younger generations. Respondents were asked whether they thought the younger generation would have fewer or more opportunities, measured on a five-point scale. As shown below, only 32 percent believe that opportunities for the younger generation are improving “significantly” or “somewhat,” while 47 percent expected opportunities to decline “significantly” or “somewhat.”
Such a degree of pessimism may be explained by the mega-crises of recent years; but, on the other hand, it is surprising in view of the ongoing expansion of education as well as economic and technological development.
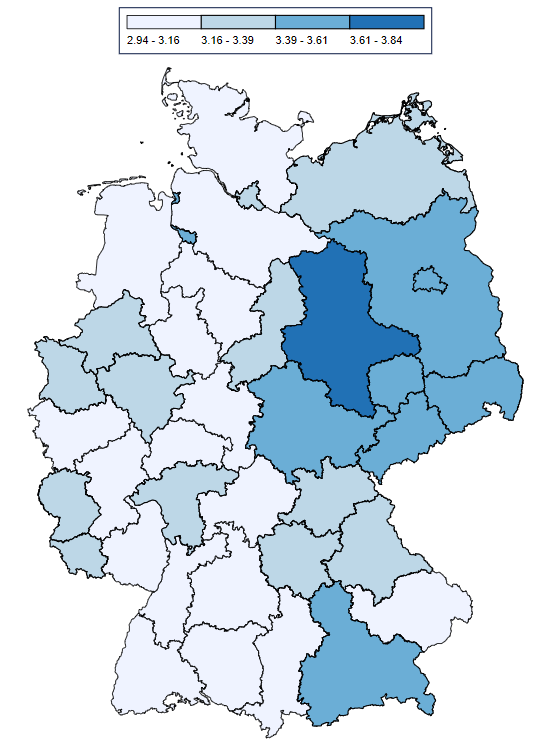
Perceptions of inequality within home regions compared to the rest of Germany
The map displays the average responses of people from different administrative regions of Germany (Regierungsbezirke) when asked to assess the level of inequality in their home region compared to the rest of the country. Respondents were asked to rank this inequality on a 5-point scale from (1) 'much lower' to (5) 'much higher'.
The darker blue regions of the map represent areas in which inhabitants perceive a higher level of inequality. As we can see, there are still clear differences between Eastern and Western Germany: Respondents from East Germany perceive there to be a higher level of regional inequalities within Germany than West Germans.
First survey wave
The first wave was conducted in September 2020 with a sample of 6,000 respondents from the adult population in Germany. The results have been published and have found a broad echo:
Luna Bellani, Nona Bledow, Marius R. Busemeyer, Guido Schwerdt (2021): When everyone thinks they’re middle-class: (Mis-)Perceptions of inequality and why they matter for social policy. Policy Paper 06: Inequality Barometer – Inequality and Social Mobility. 26. Mai 2021.
Abstract: Current levels of social and economic inequalities are an enduring challenge for policymakers concerned with sustaining high levels of prosperity and social mobility. Understanding which types of inequalities people in Germany regard as important is crucial. Using survey data, this paper presents evidence that misperceptions about inequality among the German population are common. Inequality is perceived as a problem and most respondents would prefer a more egalitarian society. However, people still underestimate the extent of inequality in important ways. This suggests that there is the potential for a policy agenda that emphasizes progressive and egalitarian policies. For such policies to gain public support, they should be tied to information on specific aspects of inequality.
Follow-up wave
A follow-up wave was conducted in September 2021. This was a smaller survey, with 3,000 respondents from the first wave. This survey repeated elements from the core in addition to two of the modules. Working papers on the results of this wave are still in progress.